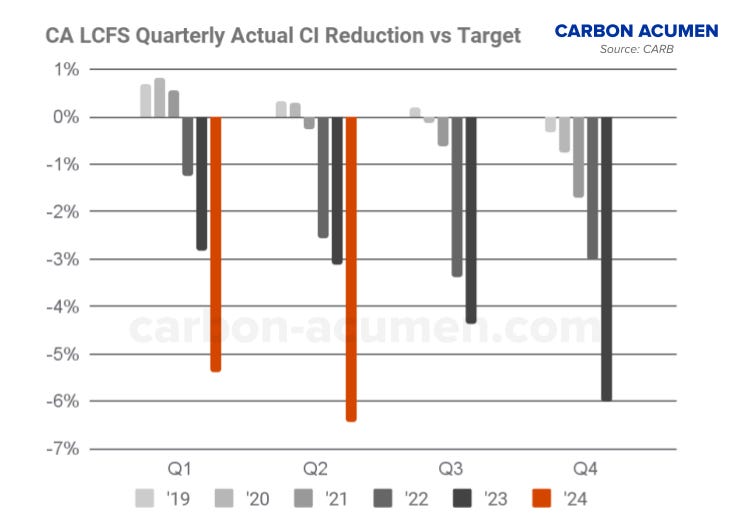
CARB reported LCFS data mid-to-late afternoon yesterday showing a record net credit generating quarter in Q2 of 3.12 million MT bringing the credit bank to over 29 million MT.
CI Reduction
Actual CI reduction for Q2 hit almost 19%. To put in context how dramatic the increase in reduction Q2 was, Q2-2023 was at 14.4% CI reduction, a 450 bps YoY increase or 4.5% step down. CRAZY!! California did not reach a 10% CI reduction until a decade of the program which occurred in Q4 2021. It is not a crazy idea the next 10% of CI reduction occurs in a 3 year time frame. Another way of looking of the steepening Actual CI reduction curve:
First 5%: took 29 quarters
Second 5%: took 11 quarters
Third 5%: took 7 quarters
Fourth 5%: likely 3-4 quarters
And as the year progresses, the back half of the year (Q3+Q4) is where you see the largest CI reductions.
Just another way of looking at the rapid increase in CI reduction vs the target. Thus why CARB is likely to vote to pass the LCFS amendments next week (more on this topic later).
Credit Generation
Credit generation hit an all-time high in Q2 at 9.16 million MT driven by the ‘Big 3’ of Renewable Diesel (RD), EVs (Electricity), and RNG (the crazy -CI Ag Digesters). Credit generation from other fuels such as Biodiesel, Ethanol, SAF, Hydrogen, etc hit at 1.5 million MT, right in line with past 6-7 years.
The growth in YoY credit generation came from the ‘Big 3’ plus a nice bump from Ethanol. Biodiesel continues downward.
RD: +658k MT (+23% YoY)
Electricity: +470k MT (+27% YoY)
RNG: +506k MT (+37% YoY)
Ethanol: +174k MT (+24% YoY)
Biodiesel: -28k MT (-6% YoY)
Biomass Based Diesel (mainly RD)
The blend of Biomass Based Diesel (BBD) in California climbed to over 75% of the diesel in Q2 with of course RD leading the way. Biodiesel blend dropped to below 6.4%, the lowest blend in 5+ years (Q1 2019: 4.7% blend). Meanwhile the RD blend in the state rose to over 69%.
Total liquid diesel reported to CARB in Q2 was 873 million gallons, a YoY drop of 1.5%.
Diesel: 215 million gallons
RD: 603 million gallons
Biodiesel: 55 million gallons
Total Diesel+RD+Bio: 873 million gallons
Virgin oils such as Canola +SBO used as feedstocks for the production of BBD climbed to an all-time high of 240 million gallons or 36% of total production which is above the 20% feedstock “cap” proposed in the new LCFS amendments.
However Canola+SBO Biodiesel used in California is under the 20% as only roughly 10% of the Biodiesel consumed in Q2 was made from Canola or SBO.
On the other hand roughly 39% of the RD reported under LCFS in Q2 , or 235 million gallons worth, comprised of being made from Canola + SBO.
If you are looking to dive deeper into the entire RD+Bio supply chain from feedstocks to fuels, check out the report below. It is ABSOLUTELY THE BEST all-in-one report showing feedstock imports by origination/destination, fuel production, and consumption (all the RD ain’t going to California folks).


